Jo Nova: There were Bigger Floods and Rain-bombs in the 1800’s

Jo Nova writes:

If only the $3 million dollar a day ABC could afford a science team that could do as much research as one unpaid volunteer does in a day?

Thanks to Cliff Ollier and Ken Stewart for the BOM graph of past Brisbane Floods. Clearly things were worse in the 1800s.

If CO2 has any effect perhaps it reduces flooding?

There have always been big floods in Brisbane       | BOM Source   |  KensKingdom

One day when the ABC finally gets the Internet they’ll be able to find official pages like “Known Floods in the Brisbane and Bremer River Basin“. And one day the half billion dollar BOM agency will be able to update graphs like this within a week of a new flood peak, like bloggers did (above).

Ken Stewart went looking for lost Rain Bombs and found them

As Ken reports the ABC made a fuss over three Queensland sites recording more than 1 metre of rain in just four days. But neither the ABC or the BOM is telling Australians that there have been at least nine similar “Rain Bombs” before and most of them were more than one hundred years ago.

I went looking at Climate Data Online for four day rainfall totals over one metre, to compare with the recent totals above at Mount Glorious, Pomona, and Bracken Ridge. For a start, Pomona’s BOM station has been closed for years, and Bracken Ridge is not listed at all, so those reports are from rain gauges external to the BOM network and can’t be checked.  That’s OK.  In about half an hour I found the following four day rainfall records.

Crohamhurst4/2/18931963.6mm
Yandina3/2/18931597.8mm
Tully Sugar Mill13/02/19271421.3mm
Palmwoods4/2/18931244.6mm
Buderim3/2/18931150.3mm
Bloomsbury20/01/19701141.8mm
Dalrymple Heights6/04/19891141mm
Innisfail3/04/19111075.8mm
Nambour11/1/18981013mm

1893 was a wet year!  Crohamhurst had 2023.8 in five days, and Brisbane had three floods in two weeks in February and another in June.

And there is no such thing as a “rain bomb”, a term invented to make it sound unprecedented.  This was an entirely natural and normal rain event.  Slow moving tropical lows drift south every few years in the wet season, producing a large proportion of Queensland’s average rainfall.

It’s another Red pill moment. Spread the news. Australians need to know the media and the BOM are not giving them the whole truth. Has anyone in the BOM called up the ABC and corrected their mistake? Isn’t that their job?

The Green Industrial Revolution Is A Lie

As we gear up for a Federal election in May, you can be sure that Labor and the Greens will peddle the fantasy about “Green Jobs”. It is a lie, like the one about renewable energy being cheaper than coal, not to mention the whole climate change scam.

Ben Pile writes on spiked:

The green industrial revolution is a lie

The UK’s green sector has not grown in nearly a decade.

The green industrial revolution is a lie

Share

TopicsPOLITICSSCIENCE & TECHUK

The Office for National Statistics (ONS) published data earlier this month which showed that the UK’s ‘low-carbon and renewable-energy economy’ (LCREE) had not grown significantly between 2014 and 2020. This performance is a far cry from the promises of plentiful ‘green jobs’ and a ‘green industrial revolution’ that have echoed around Westminster for the past decade and more. It turns out that the much heralded green growth was nothing more than mould.

This news should surprise no one. As I have argued elsewhere on spiked, the green industrial revolution is a lie. Since the 2008 Climate Change Act, successive governments have embraced the fantasy of leading the world in the ‘transition’ to a low-carbon economy. And it’s all been to no avail. The rest of the world continues to increase its consumption of fossil fuels despite endless COP meetings, and Britain’s green industrial revolution stubbornly fails to materialise.

Back in 2009, the then Labour government, led by Gordon Brown, claimed the green economy was already thriving. He promised to add 400,000 new ‘green jobs’, taking the total number of people working in the green sector to 1.3million. These claims were based on proprietary data produced by an economic research company, which refused to share its data, as did the government even after freedom-of-information requests.

Even without access to the data, I was already able to point out in 2009 that growth in the ‘green economy’ is an illusion – or better still, an accountancy trick. The government was effectively compelling sectors of the economy, through a variety of green regulations, to ‘decarbonise’ their operations. It was then adding said sectors to the green economy and so the green economy appeared to be growing. This was happening even when the sectors in question had been harmed and diminished by the new regulations.

It took me until 2013 to obtain the data on which successive governments were basing their figures, policies and predictions. By then, it was being claimed that the ‘green economy’ was worth £122 billion. But it had only reached this size because the figure included sectors of the economy that simply do not qualify as ‘green’ in any meaningful sense. It even included the production, transportation and sale of liquefied natural gas and liquefied petroleum gas – otherwise known as fossil fuels – merely because such businesses were now subject to environmental regulation. My analysis at the time suggested that through such tricks, the government’s financial wizards had inflated the value of the ‘green economy’ by something in the region of 700 per cent.

Read the full article here

Giant Reef Discovered Near Tahiti

Australian media seem to have been silent about the discovery of a giant pristine reef near Tahiti, apparently untouched by “climate change.” Makes you wonder how it has coped without UNESCO World Heritage listing or environmental worriers trying to “protect” it.

From Canada’s CBC:

Scientists have discovered a pristine, three-kilometre-long reef of giant rose-shaped corals off the coast of Tahiti, in waters of the southern Pacific Ocean thought to be deep enough to protect it from the bleaching effects of the warming ocean.

The reef, which lies at depths of more than 30 metres, probably took around 25 years to grow. Some of the rose-shaped corals measure more than two metres in diameter.

“It was magical to witness giant, beautiful rose corals, which stretch for as far as the eye can see. It was like a work of art,” said French photographer Alexis Rosenfeld, who led the team of international divers that made the discovery.

Most of the world’s known coral reefs are in warmer waters at depths of up to 25 metres, the United Nations Educational, Scientific and Cultural Organization (UNESCO) said. The reef off Tahiti lies in the “twilight zone” 30 to 120 metres below the surface where there is still enough light for coral to grow and reproduce.

UNESCO says the newly discovered reef is one of the largest in the world.

Bleaching is a stress response by overheated corals during heat waves. They lose their colour, and many struggle to survive.

Perhaps the most famous — Australia’s Great Barrier Reef, a World Heritage-listed wonder — has suffered severe bleaching to an estimated 80 per cent of its corals since 2016.

The discovery off Tahiti’s shores suggests there may be many more unknown large reefs in our oceans, given that only about 20 per cent of the entire seabed is mapped, according to UNESCO scientists.

“It also raises questions about how coral reefs become more resilient to climate change,” UNESCO’s head of marine policy, Julian Barbiere, told Reuters.

More of the ocean floor needs to be mapped to better safeguard marine biodiversity, Barbiere said.

“We know more about the surface of the moon or the surface of Mars than the deeper part of the ocean.”

The BOM Adjusts Historical Data to Make the Warming Look Warmer

If you have to prop up a scientific theory by changing historical records in an unscientific way, and still claim to be doing “science” then you are having yourself on and the rest of the nation. This is the problem when taxpayer funded bodies do science for the activists.

from Jo Nova

The Bureau of Meteorology finds Australia is still getting colder a century later

Surprisingly, the World War I era temperatures are still changing. Mornings that seemed nippy at the time are now susceptible to frosts.

Someone should warn the farmers — except they’re all dead.

Thanks to Chris Gillham for independently and laboriously going through the new unannounced changes in another cycle of BOM’s hidden revamp of Australia’s history. ACORN 2.2 is the latest version of the Australian Climate Observation Reference Network of “the best” 112 weather stations across Australia.

Bureau of Meteorology ‘cools the past, warms present’

Graham Lloyd, The Australian

“The bureau has now remodelled the national temperature ­dataset three times in just nine years,” Dr Jennifer Marohasy said.

In the last five years the ACORN re-revisions by the BOM have discovered another quarter of a degree of warming that we didn’t know about from the last hundred years. It’s not clear why the BOM doesn’t want to tell the world how good they are at correcting thermometer records from 1913.  It seems like a remarkable skill.

The minima just keep getting cooler

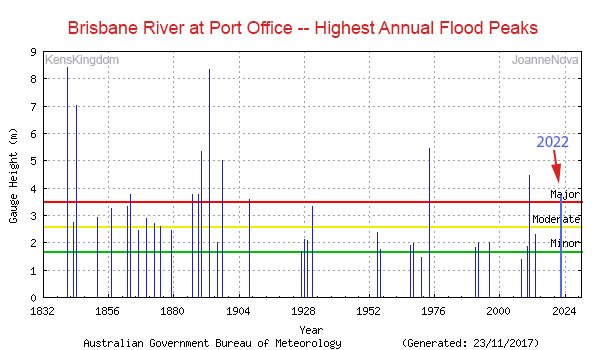
Chris Gillham plots the longest running stations from the ACORN 2.2 set against the old raw readings:Chris Gillham, ACORN 2.2 versus Raw Temperatures

Who knew all those old thermometers were so wrong?

Graham Lloyd:

Independent analysis of the latest changes show they added 0.06C to maximum warming and 0.11C to minimum warming from 1910-19 to 2010-19.

A series of updates to the ACORN data have added 0.228C mean temperature warming if comparing 1910-19 with 2010-17 (2017 being the final year of ACORN 1)

Clearly, the cheapest way to stop global warming would be to sack everyone at the BOM.

The Bureau admitted to Lloyd that they changed 25 sites in the latest round, most of them because of statistical revelations:

The bureau said changes were made to 20 sites on the basis of statistical analysis. According to the bureau, statistical analysis is used to identify an abrupt warming or cooling at a particular site, relative to other sites in the region.

The BOM refuses to tell us exactly how they do this — admitting that they can’t train anyone outside their sacred guild. Which reminds us of the old axiom, “if it can’t be replicated, it isn’t science”.

Apparently the future of life on Earth depends on their data, but it would take too long to train someone outside BOM to check it. Tell us again, how much does climate change matter?

Here’s the BOM explanation of the need for adjustments:

“A significant change relative to other sites indicates a non-­climatic driver, which sometimes has an easily identifiable cause (e.g. a new building near a site) and sometimes does not (often these will relate to local vegetation or land surface changes)”, the bureau said. “In carrying out this statistical analysis, the bureau uses 10 years’ worth of data from multiple sites to quantify the size of the change. Adjustments are only applied where a significant change has been identified.

So instead of researching the site history as deeply as they can, the BOM use statistical trickery analysis to figure out local site changes using some other thermometers “within a thousand miles”. What they don’t do is full historical research and documentation of the sites first. (Like the ones herehere and here, thanks Bill Johnston). So it’s possible that if, say, 10 sites got similar changes at the same time (like changing to a new small screen) the other better sites in non-changing screens could be slowly “corrected” one-by-one by the junkier sites with the right statistical algorithm. Now, perhaps the BOM have ways to make sure that doesn’t happen — but they won’t tell us what they are, they don’t publish the detailed documentation of either the full site histories or the methods they use to correct them.

As Chris Gillham notes, the BOM say the new adjustments didn’t change the long term trend. But a lot of little changes in the same direction would. The new adjustments might have also made a few local hottest ever headlines much easier to get. Suddenly the modern contenders for the longest heatwave, warmest night, and hottest summer all got a head-start.

The mysterious process of homogenization

The Bureau “homogenizes” a site according to a mystical method that uses an inexplicable group of sites that are in the same region, or at least in Australia somewhere. For example, lighthouse readings off the Bass Strait have been corrected with help from Hay, 600 kilometers away, on the other side of the Great Dividing Range. A thermometer in Ballarat has been used to correct one at Bruny Island off the South coast of Tasmania.  The BOM has also corrected Alice Springs using measurements in Collarenabri nearly 1,600 kilometers away. (Thanks to Ken Stewart for that tip). When I said “a thousand miles” I wasn’t joking.Australian BOM, Bureau of Meteorology, homogenisation of sites. Map.

All the sites marked in black, for example, have been used to homogenize Alice Springs

The Sad State of Science

Science, as it is popularly understood, is in a parlous state. Politics and activists have captured important areas of research such as climate science and virology. People make stuff up and rely on dodgy computer “models” to make apocalyptic predictions, and nobody is ever held to account.

Now we have major science journals publishing mountains of computer-generated gibberish. So much for peer review.

Jo Nova writes:

Sea level height based on aerobics and other gibberish published in top science journals

Nature and Elsevier are agog and aghast that hundreds of junk papers filled with random word salad have been published in their esteemed journals.

It’s as bad as it sounds — one retracted title was: “‘Sea level height based on big data of Internet of Things and aerobics teaching in coastal areas’. “

They are shocked that  scammers who were “organised” and “sophisticated” found tricks to get published — wait for it — not just by hyping up, adjusting and exaggerating their cherry-picked papers and incompetent models, but with nothing more than fake e-mails “with ‘univ’ instead of ‘uni’ and ‘-ac.uk’ instead of ‘.ac.uk’”. That’s right, the highest and most intellectual “peer review” journals in the world have such inadequate, nonexistent standards, that not only do they fail to weed out weak papers, they couldn’t even defend themselves against randomized nonsense coming from fake professors with dodgy emails.

In other words, no one who matters even reads the papers before they are published.

Indeed, no one even read the titles…

Scammers impersonate guest editors to get sham papers published

Nature

Hundreds of articles published in peer-reviewed journals are being retracted after scammers exploited the processes for publishing special issues to get poor-quality papers — sometimes consisting of complete gibberish — into established journals. In some cases, fraudsters posed as scientists and offered to guest-edit issues that they then filled with sham papers.

Elsevier is withdrawing 165 articles currently in press and plans to retract 300 more that have been published as part of 6 special issues in one of its journals, and Springer Nature is retracting 62 articles published in a special issue of one journal. The retractions come after the publishers each issued expressions of concern earlier this year, covering hundreds of articles.

Guillaume Cabanac,  a computer scientist who uncovered nonsense papers, was shocked:

…it is shocking to see such papers in journals from ‘flagship’ publishers and that “it is not only predatory journals that publish bullshit”.

The papers are computer generated junk:

 71 articles have abstracts or titles that contain the words ‘dance’, ‘aerobics’ or ‘sports’ in relation to geoscience, including the articles ‘Sea level height based on big data of Internet of Things and aerobics teaching in coastal areas’ and ‘Rock stress and deformation characteristics based on SVM and sports high-intensity interval training’.

And it’s all happened before — in 2014 at least 120 papers were “computer generated nonsense” and were published and later retracted. It’s emblematic of the entire academic sector really. An industry using AI to produce nothing, discover nothing, get published, and then write papers about it?

So who benefits?

But the scammers’ motivations remain a mystery to Ivan Oransky, a journalist who runs Retraction Watch. Even the article titles, which would be listed as part of an individual’s publication record, often do not make sense, he says. “The papers are so obviously terrible, so why would you want them on your CV?”

Many of the papers were from authors based at Chinese institutions, and most contained nonsensical phrases that Elsevier thinks came from the use of reverse-translation software to disguise plagiarism.

Perhaps Western professors are trying to plump out their bio’s with statements about “publishing 412 Nature papers” and just paid a paper-scam generator in China. But who’d really want their name on papers like these? These papers are so bad, they look like the hoax papers done purposely to expose the rot in academia.Will a team appear next week admitting the papers were faked to test the system? Or are there just too many incentives for Chinese or other academics to “publish or perish”?

Either way, Western Civilization is paying tillions of dollars to change the weather based on “The Science” according to peer review — which appears to have no more intellectual prowess than a Nigerian 419 email scam.

Peer review is anonymous and unpaid and worth every cent.

SCIENCE: Warming Not Due To Carbon Dioxide

This is a pretty technical article, but the bottom line is this. Nearly all of the warming seen this century is due to a reduction in cloud cover NOT by carbon dioxide or other human causes. Of course, the renewable energy and emissions reductions band wagon was never about science.

From Watts Up With That:

2001-2019 Warming Driven By Increases In Absorbed Solar Radiation, Not Human Emissions

7 hours agoGuest Blogger94 Comments

Reposted from the NoTricksZone

By Kenneth Richard on 18. October 2021

Three new studies affirm the increase in absorbed solar radiation associated with decreased reflection by clouds (albedo) has been the “root cause” of the positive Earth Energy Imbalance and global warming since the early 2000s.

Scientists (Loeb et al., 2021) have determined the rather uncertain positive trend in Earth’s Energy Imbalance (EEI) from 2005 to 2019, 0.5 W/m² ±0.47 W/m² per decade−1, is “primarily due to an increase in absorbed solar radiation associated with decreased reflection by clouds.”

CERES satellite data indicate clouds and surface albedo account for 89% of the absorbed solar radiation trend in the 21st century, whereas anthropogenic greenhouse gases account for but a tiny fraction of the trends in combined absorbed solar radiation and greenhouse effect forcing (reductions in emitted thermal radiation) during this period.

This very small human emissions/greenhouse gas impact is represented by the red “Other” (“trace gases”) bars in the graph below. In emitted thermal radiation, graph (e) shows the greenhouse gas impact is effectively offset by the cloud influence; both factors are cancelled out by temperature changes. This leaves the increase in absorbed solar radiation shown in graph (d) due to natural variations in clouds and surface albedo (SFC) as the primary driver(s) of top-of-atmosphere (TOA) flux forcing during the last two decades.

Image Source: Loeb et al., 2021

Other scientists (Dübal and Vahrenholt, 2021) have also concluded that the positive TOA net flux (+1.42 W/m²) from increasing downwelling shortwave (SW) facilitated by a drop in cloudiness has been the “major driving effect,” “dominating influence,” and “major heating cause” explaining the 2001-2019 ocean heat content increase (240 ZJ).

The authors note these CERES satellite observations “conflict with the assumption further global warming originates mainly from the LW [longwave] radiation capture caused by greenhouse gases, i.e., a decline in outgoing LW.” In fact, the LW or greenhouse effect impact has been negative; it has contributed a net cooling influence (-1.1 W/m²) over the last two decades.

Image Source: Dübal and Vahrenholt, 2021

The summarizing text from another new study (Ollila, 2021) bluntly asserts the substantial increase in downwelling SW radiation from 2000-2019 demonstrates “there are natural climate drivers that have rapid and significant temperature impacts exceeding the anthropogenic drivers,” and that any temperature increase since 2015-’16 “cannot be due to anthropogenic reasons.”

Read the full article here

Jo Nova:Suddenly Nuclear Energy is popular

Jo Nova writes:

Suddenly Nuclear Energy is popular

The Gösgen Nuclear Power Plant (in German Kernkraftwerk Gösgen, abbreviated in KKG) is located in the Däniken municipality (canton of Solothurn, Switzerland)

The Gösgen Nuclear Power Plant  by Pareixk Federi

The global energy crisis is squeezing the green religion to its logical endpoint. As long as we pretend “carbon” is pollution, the only way out of the maze for badgered politicians is nuclear power. The renewables industry may have thought that beating us over the head with climate propaganda was going to make renewables dominant and profitable, but it may just push everyone into nukes instead.

With the gas price crisis, wind drought, and coal shortage, suddenly everyone is talking about nuclear power:

Nations Go Nuclear As Prices Spike & Renewables Fail

Michael Shellenberger

National leaders around the world are announcing big plans to return to nuclear energy now that the cost of natural gas, coal, and petroleum are spiking, and weather-dependent renewables are failing to deliver.

France was reducing nukes from 70% to 50% of its total power generation fleet, but not any more:

“The number one objective is to have innovative small-scale nuclear reactors in France by 2030 along with better waste management,” said French President Emmanuel Macron.

 “But the mood has now changed,” the paper writes today. “Macron said on Tuesday he would begin investing in new nuclear projects ‘very quickly.’”  — Financial Times.

Public support for nuclear energy rose 17 percentage points in France. “I do not want our country to lose its energy sovereignty under the pretext of an absurd energy transition copied from Germany,” said a conservative French presidential candidate seeking to defeat Macron.

Finland has joined France, Poland, Hungary, the Czech Republic in lobbying the European Union to categorize nuclear power as sustainable.

Yesterday, Japan’s new prime minister, Fumio Kishida, defended his pro-nuclear policies in Parliament. Kishida came to power on a pro-nuclear platform.

Half of Australia wants nuclear power

The AUKUS “nuclear subs” announcement was a bolt from the blue after decades of Nuclear-free energy debates. But a recent poll shows Australians are rapidly growing to like the idea.  Of course, electricity prices have rocketed since 2015 too, adding to the shift.

In 2015, forty percent of Australians supported it, and forty percent opposed it, and one hundred percent of politicians avoided discussing it. Now suddenly, we’ve bought a couple of nuclear subs and in a blink 50% support nuclear power and only 30% oppose it.

Just like that, and with no discussion, suddenly nuclear power has potential. Imagine what the numbers would be if people actually discussed it?

The bottom line is that the West had better hurry.

China is the Fastest growing Nuclear Power in the world

As Jo Nova said in May:

China is poised to be the largest global nuclear power by 2030, overtaking the USA in the next nine years. In the last twenty years, China has increased its fleet of nuclear power reactors from three to 49, with 17 more plants under construction. That means it will soon surpass France which has 57 reactors. At the rate the USA is closing plants, China may hit the No 1 spot faster than expected.

China has a nuclear Belt and Road project too, Argentina, Iran, Pakistan:

Future projects are also being developed in Eastern Europe, the Middle East, and South America

Brown coal is still the cheapest kind of electricity there is, and we are mad not to use it, especially because it’s only $30 a MWh and  feeds plants and we have a 300 year supply sitting there in the ground.Rise of Nuclear Power in China. Graph.

Rise of Nuclear Power in China. Graph.

Jo Nova: South Pole has coldest winter ever, but it’s just “a blip”

Jo Nova points out something that the climate establishment, including the green media, doesn’t want you to hear.

South Pole has coldest winter ever, but it’s just “a blip”

The sun has just risen on South Pole after the coldest six month period on record since 1956. The last winter there was suddenly 2.2 degrees Celsius colder than the average for the last 30 years.

Remember when Polar Amplification meant Antarctica was melting?South Pole Sunrise from the coldest winter ever.

Thanks to NoTricksZone

South Pole Sees Record Cold Winter, Smashing 1976 Record …“Chill Was Exceptional”

Jason Samenow and Kasha Patel, Washington Post

The chill was exceptional, even for the coldest location on the planet.

The average temperature at the Amundsen–Scott South Pole Station between April and September, a frigid minus-78 degrees (minus-61 Celsius), was the coldest on record, dating back to 1957. This was 4.5 degrees lower than the most recent 30-year average at this remote station, which is operated by United States Antarctic Program and administered by the National Science Foundation.

One hot weekend in Miami is Climate change but the coldest six months in Antarctic records is a blip:

While impressive and unexpected, scientists characterized this record as a mere blip and curiosity as both Antarctica and the planet continue to rapidly warm amid escalating extreme weather.

Antarctica has been cooling for a thousand years (or maybe 2,000). That’s a long blip.

Cooling for a thousand years.

Climate change has been making Antarctic summers cooler too. Blips are everywhere.

Surface Air temperature over East Antarctica (presumably in summer) from Hsu et al 2021.

And the ocean around Antarctica is cooler too:

The extreme cold over Antarctica helped push sea ice levels surrounding the continent to their fifth-highest level on record in August, according to the National Snow and Ice Data Center.

As usual, scientists didn’t predict the record cold — but they knew why it happened:

“Basically, the winds in the polar stratosphere have been stronger than normal, which is associated with shifting the jet stream toward the pole,” Amy Butler, an atmospheric scientist at NOAA, wrote in a message. “This keeps the cold air locked up over much of Antarctica.”

No climate story is complete without the cult litany:

Scientists stressed that the record cold over the South Pole in no way refutes or lessens the seriousness of global warming. Antarctica is notorious for its wild swings in weather and climate, which can run counter to global trends.

At minus 60C even the planes don’t go:

Matthew Lazzara, Antarctic scientist said “At these temperatures, it is difficult to operate aircraft,” he wrote in an email. “[B]etween -50°C and -58°C you put the aircraft at risk with the hydraulics freezing up or fuel turning into a jelly.”

Click here to read the full article

Great Barrier Reef growing at record rate

Jo Nova writes:

What climate disaster? The Great Barrier Reef has more coral growing on it than ever recorded

The coral cover as sampled by AIMS across the entire Great Barrier Reef is not just good, but better than it has ever been in the 36 years they have been studying it. If the reef is in danger — it’s from being overgrown with coral. Climate Change, such as it is, has caused no trend at all.

If anything, in the spirit of modern-media-science, climate change causes record coral growth.

Tonight the UN scientists decided not to list the reef as “in danger”. The ABC and every Green group who normally follow UN scientists slavishly said that was “only because of lobbying”.

Record Coral Cover on the Great Barrier Reef.

The new AIMS report on Monday showed the Great Barrier Reef had a remarkable recovery, but the graphs were of three different sections of the reef (North, central and South). Peter Ridd obtained all the data and combined it to make one graph and discovered that the coral cover of 2020 was a new all time record high.

Strangely none of the government agencies or paid Professors discovered this. You have to be unemployed to discover record coral growth.

Science and media doomsayers ignore good news on reef

Peter Ridd, (The Professor that JCU sacked for being “non-collegial”) The Australian

Like all other data on the reef, this shows it is in robust health. For example, coral growth rates have, if anything, increased over the past 100 years and measurements of farm pesticides reaching the reef show levels so low that they cannot be detected with the most ultra-sensitive equipment.

This data is good news. It could hardly be better. But somehow, our science organisations have convinced the world that the reef is on its last legs. How has this happened?

The only thing the reef is plagued with is “experts”:

It was reasonable in the ’70s to be concerned about these plagues and they ultimately precipitated AIMS’s long-term monitoring of coral and starfish in the ’80s. I was working at AIMS when this important work started, and it is interesting to look back on what has changed. The coral cover is no less, the number of starfish is no more, but the number of scientists and managers working on the reef has exploded. Perhaps this is the problem.

Record coral cover means there was no disaster on the reef. The only disaster is the quality assurance at the science organisations.

In the last few hours the Great Barrier Reef barely escaped being labeled as “in danger” by a branch of the China-friendly-UN. Instead UNESCO will leave it at “critical” and decide again in a year if the 340,000 square kilometer reef is in danger of turning into a calcium-carbonate quarry.

The Australian ABC has already decided this was only because the Minister played games and pulled some tricks on a “whirlwind diplomatic effort” to override the UN body’s scientific advisors. Apparently the science advisors of the UN are so corrupt they can be bought off with a few rushed phone calls from a minor Australian minister, but these same advisors would never be influenced by the giant Chinese Communists with their billion dollar Belt and Roads, debts and honeypot traps.

Remember the UN experts are always right except when they’re not.

But China still wins this round of sabre rattling. By leaning on the UN to tell Australia off, the Australian government is still  tying itself in knots and spending millions to save a reef that has already saved itself.

We’ll have to hand in our homework report again as soon as February 2022. And the hack-media are not reporting on why UNESCO don’t care about China’s concrete-the-reef approach.

Greenpeace et al, who would have told us how horrified they were if the reef was listed as “in danger”, said they were disappointed it was not.

UNESCO would not get away with these absurdly transparent games if the Western media and most universities did not provide continuous running cover for their hypocrisy.

REFERENCE

The Australian Institute of Marine Science’s (AIMS) Long-Term Monitoring Program – Annual Summary Report on Coral Reef Condition for 2020/21

Latest Great Barrier Reef Condition Report

The Reality Of Green EVs

From wattsupwiththat.com

I especially like the part about Scotland cutting down 1.4 million trees to make way for wind farms. Way to go, Scotland!

For 40% Of The EU And US To Drive EVs, 56,000-70,000 Km² Of Land Must Be Cleared For Wind Turbines

By Kenneth Richard on 15. July 2021

A new study warns that “a massive expansion of impervious surfaces” is an inevitable consequence of having electric vehicles reach a 40% share of citizens’ driving needs.  A land area the size of Croatia (in the European Union) or West Virginia (in the United States) must be completely covered with wind turbines to meet EV-charging energy demands for 4 of every 10 vehicles.

The already-weak power capacity of wind turbines, 0.5 We m² on average, will only continue to diminish as more wind farms are added to the landscape (Miller and Keith, 2018).

Consequently, the land area that must be devoted to the erection of wind turbines to meet the ever-growing energy needs of Earth’s citizens is harrowing.

Consider the US. Electricity generation only accounts for 17% of the US’s primary energy consumption. For wind energy to supply all the electricity needs for US citizens, a land area the size of California – 12 percent of the contiguous US – must be cleared to make way for wind farms (Miller and Keith, 2018). Again, that’s to meet just 1/6th of Americans’ energy needs.

Image Source: Miller and Keith, 2018

In Scotland, 14 million CO2-absorbing trees were recently chopped down to make way for wind farms. This way the Scottish government can ironically claim they’re doing their part to reduce CO2 emissions.

And now a new study documents how much more land must be converted to impervious surface so that new wind farms can supply the electricity to charge an exponentially-growing number of EVs in the coming decades.

“In order to run 40% of their vehicles with electricity, the EU should devote over 5000 km² of land (twice the size of Luxembourg) to photovoltaic panels or almost 56,000 km² (about the size of Croatia) to wind turbines, whereas the US should devote over 6000 km² (roughly the size of Delaware) to solar or almost 70,000 km² (more than the area of West Virginia) to wind.”

Image Source: Orsi, 2021

Put another way, an average EU or US city will need to expand its urbanized area by 0.2 to 4 km² due to dramatically rising number of EVs using low-density wind and solar energy to supply electricity.

And this is green?