Jo Nova: Renewable Fiasco: If Germany just kept nuclear power, it could have saved $600b and cut emissions by 73%

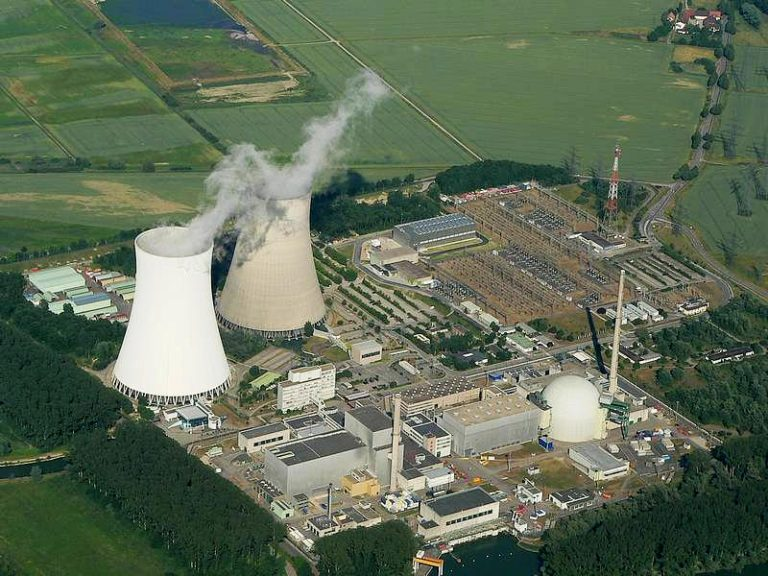
Phillippsburg Nuclear Power Plant by Lothar Neumann, Gernsbach

By Jo Nova

If the Germans just did nothing at all, it would have been Greener

Germany already had nuclear power in 2002, if they just kept it and didn’t build all the wind and solar plants, they wouldn’t have had to spend 697 Billion Euro on subsidies, and would have cut their emissions by 73% more.

If ever there is a statistic that says there is something rotten in the State of Climate Panic, this is surely it. I mean, does CO2 matter or doesn’t it? Do the Greens care at all, or even a bit? If there was a climate emergency and The Greens were worried about CO2, they might have protested that the EnergieWende was a reckless experiment. Instead the  But if the Greens were tools for communists, foreign states or banker-investors, then they might keep choosing options that benefit other countries, help Bankers or just make Big Government bigger.

Either the German Greens have utterly failed at the very task they set out to do, or they were really aiming at something else.

Ross Pomery writes at RealClearScience and  WattsUpWithThat

Study Quantifies Germany’s Disastrous Switch Away From Nuclear Power

At the dawn of the millennium, Germany launched an ambitious plan to transition to renewable energy. “Die Energiewende” initiated a massive expansion of solar and wind power, resulting in a commendable 25 percent reduction in carbon emissions by 2022…

In 2002, nuclear power supplied about a fifth of Germany’s electricity. Twenty-one years later, it supplied none. A layperson might think that cheap wind and solar could simply fill the gap, but it isn’t so simple.

Jan Emblemsvåg, a Professor of Civil Engineering at Norway’s NTNU just published a study comparing the ambitious German Energiewende renewable program with nuclear power:

“what if Germany had spent their money on nuclear power and not followed their policy from 2002 through 2022 (20 years); would Germany have achieved more emission reductions and lower expenses?”

Even German bureaucrats admit Energiewende “poses a threat to the German economy”:

German Federal Accounting Office (Bundesrechnungshof) writes about the German policy dubbed ‘Die Energiewende’ in German, and it concludes: ‘The Bundesrechnungshof warns that the energy transition in its current form poses a threat to the German economy and overburdens the financial capacity of electricity-consuming companies and households’ (Bundesrechnungshof Citation2021a).

A whole lot of wind (green) and solar (orange) power were added to the German grid and it was worse than useless:

Energiewende, Germany

Given these results, there can be no doubt whatsoever that if Germany had invested in NPPs [Nuclear Power Plants] instead of VREs [Variable Renewable Energy], Germany would have decarbonised more with far less nominal expenditures. The short conclusion is that Germany would have reached its climate goals with a substantial margin at half the expenditures of Energiewende.

The Germans have done this experiment so we don’t have to

Just burn that money in a pyre to the Weather Gods:

https://www.tandfonline.com/doi/full/10.1080/14786451.2024.2355642#d1e128

These costs do not included the added burden of expensive electricity on businesses and homes, the opportunity costs of money that could have been spent elsewhere, or the loss of talent, brains and industry to other countries.

Building new nuclear plants was still cheaper than wind and solar

The paper goes through another scenario where more nuclear plants were built with careful estimations of the costs and long times to construct plants and still concludes that the Germans would have saved $330 billion euro.

https://www.tandfonline.com/doi/full/10.1080/14786451.2024.2355642#d1e128

Not coincidentally, in 2024 Germany has some of the most expensive electricity in Europe, business confidence is low, and  VW have just announced that after 87 years in production, they might have to close their German factories.

Volkswagen, which was founded in 1937, said on Monday that it could no longer rule out unprecedented plant closures in Germany as it seeks ways to save several billion euros.

Chief executive Oliver Blume said: “The economic environment has become even tougher and new players are pushing into Europe. Germany as a business location is falling further behind in terms of competitiveness.”

Volkswagen employs around 650,000 workers globally, almost 300,000 of whom are in Germany, and the threat of factory closures sparked an immediate fierce backlash …

REFERENCE

Emblemsvåg, J. (2024). What if Germany had invested in nuclear power? A comparison between the German energy policy the last 20 years and an alternative policy of investing in nuclear power. International Journal of Sustainable Energy, 43(1). https://doi.org/10.1080/14786451.2024.2355642

Predicted Droughts Give Way To Floods, But It’s Not the BOM,s Fault!

From Jo Nova

#d6b15c">The BOM predicted a hot dry summer right before the flooding rains came…

Hot Dry El Nino News.

By Jo Nova

Australians are angry the BOM didn’t see the flooding rains coming

Worse, we’re betting the nation on the BOM’s ability to predict the climate.

The Bureau of Meteorology (BOM) tells Australians that record breaking extremes are getting worse because of our cars and our air-conditioners (that’s “The State of the Climate“). But when the BOM can’t predict record breaking rain a month in advance, or even the day before, we know the BOM doesn’t understand what drives the climate.

Somehow the BOM expect Australians to spend trillions and rearrange their economy based on their fifty year prophesies, but not to mind when “this summer” goes right off the rails.

Back in September the BOM issued its El Nino alert, and Australians were told it would be a hot and dry and to prepare for a summer of bushfires. Farmer sold their lambs, and adjusted harvest accordingly.

This was the BOM solemn prediction in late October, for the very next month of rainfall

Across most of Australia the odds were only 20-40% of getting average rain.


Instead this is what happened:

Bureau of MeteorologyAustralian rainfall percentages

BOM

And in December most of the country was predicted to have a fifty fifty chance of getting “average” rain.


But the real weather gods had another idea, and all the places under any shades of green below got somewhere from 100% to 300% of the average rainfall. The indigo and purple zones got even more.

Bureau of Meteorology Australian rainfall percentages

BOM

This was a savage downpour — seven feet of rain in five days fell at one location:

No fewer than 12 locations across far north Queensland posted record rainfall totals.

Some areas received a year’s rainfall in a single day, isolating towns, closing highways and leaving hundreds stranded by surging floodwaters. Black Mountain near Cooktown recorded a cumulative 2189mm over the five days, while Mossman South, an hour northwest of Cairns, had 1935mm.

–The Australian

As the Mayor of Douglas Shire said:

“If this is so record-breaking, how did no one know this was going to happen … we need to have forecasts closer to what is going on.”

–The Australian

The BOM suddenly wants to absolve itself of liability

People have noticed there is now a mandatory check box forcing users to agree to a legal disclaimer clearing the BOM of all liability:

Users of the BOM app now have to agree to a 699-word “terms and conditions” statement that includes “information at this app … may not be accurate, current or complete”.

“To the maximum extent permitted by law, the bureau excludes any liability that may arise in connection with the BOM Weather app or any information or material presented therein or your access to or use of any of the same,’’ the bureau says in a “terms and conditions” statement that appears when a user attempts to download its app. — Mackenzie Scott, The Australian

They know they are in trouble.

I say the BOM can have immunity the same day Australians can also tick a box excluding ourselves from any and all costs, imposts and taxes related to any BOM predictions.

The Australian editors gives the BOM an escape valve it doesn’t deserve:

To be fair to the BOM, a hysterical and ill-informed media has allowed climate alarmism to infect reporting of what should be routine weather events.

For thirty years the Australian media has made hyperbolic scare stories about the weather while the BOM tacitly stood by and smiled. Where were they as the tenets of science were trashed, and critics were called “climate deniers”? If the BOM are victims of this hyperbole now, they reap what they sowed.

The BOM raised the stakes, and they don’t get to weasel out by saying “we used the best science” as if the best science wasn’t riddled with holes. If the science is good enough to throw away trillions of dollars, then the worst failures need a truckload of explanation.

Predicting the weather is hard. We could forgive the BOM for getting a complex immature science wrong, but not when they also tell us it’s just simple physics, they’re absolutely sure, and there is no doubt they’re wrong (give us your money!).

Renewable Paradise: Australia Set For Blackouts This Summer

From Jo Nova


#d6b15c">Blackouts are coming: Australian grid so fragile, expensive, cement giant already shuts down nearly every day

Fantasy, dystopia, plane in the sky.

Image by Vicente Godoy from Pixabay

By Jo Nova

We can’t even run a cement factory all day anymore

Get your candles for summer! Unlike the last three years the Australian national grid won’t be rescued by another cooler La Nina this summer. Fears of rolling blackouts this summer are fraying nerves at The Australian Financial Review Energy & Climate Summit. The transition is described as stuttering, gridlocked, faltering, and the government as “desperate”.

Things are so bad, former CEO’s of major generators are warning that “the lights are going to go out” and accusing one Energy Minister of speaking “complete and utter horseshit” because they don’t think we need reliable peaking gas plants to replace coal power. Said Energy Minister has responded by refusing to even take his calls. That’s really going to work. Meanwhile Japan is getting nervous just watching us, afraid we have screwed things up so badly we can’t be relied on to keep sending them gas.

Not only is summer nerve-wracking, but things are already so bad, one of our largest cement producers is shutting down nearly every day because it can’t afford to pay for the peak electricity spikes even in springtime. Here in Renewable World it’s cheaper to let 5,500 workers sit around for 30 minutes than pay for electricity. The company was paying 54% more for electricity than the year before.

Riding the Express Train to the Renewable Faraway Tree

The numbers are staggering. Australia is racing headlong to the glorious 82 per cent renewables target by 2030. The catch is that the national grid at the moment uses coal for 62% of its electricity. The opposition energy spokesman is calling it “lunacy”, which it is.  To reach the land of sunshine and breezes, our grid manager, the AEMO, is theoretically going to close two-thirds of the country’s existing coal power generation in the next ten years.

To put this in perspective, since the last hot summer we’ve shut down Liddell Coal plant, and still haven’t fixed the coal turbine that blew up in Queensland two years ago. New renewable investment has ground to a halt when it clearly should be going gangbusters. No one wants to build new wind and solar plants until someone builds the 10,000 kilometers of high voltage lines to reach distant cheap windy real estate, and no one wants to live or farm next to those transmission towers, so the protests are fierce.

Energy Summit confirms stuttering transition is not on track

Decarbonising Australia’s fossil-fuelled electricity grid is proving slower and more costly than previously advertised, with reliability risks increasing as the exits of coal-fired power plants run ahead of cleaner and reliable replacement generation.

Nerves are frayed “We’re not having an honest conversation”:

‘Get your candles’: energy experts are ‘terrified’ about this summer

Angela MacDonald-Smith, Australian Financial Review

Former Snowy Hydro CEO Paul Broad said, “the lights are going to go out” in a return to normal conditions after three mild summers and said politicians were not listening to the warnings about the risks around supply, while the industry was not speaking up enough.

“That’s our problem,” he said. “We’re not having the honest conversations and us in the industry we’re not speaking up.”

Mr Broad, who abruptly exited Snowy Hydro last year after a run-in with Mr Bowen, accused Victorian Energy Minister Lily D’Ambrosio of speaking “complete and utter horseshit” in her refusal to recognise the need for peaking gas power plants in Victoria as coal power exits the system.

He listed Ms D’Ambrosio among energy sector figures who would no longer take his calls as he tried to get the message through, including former Australian Energy Market Operator Audrey Zibelman.

We can’t even run a cement factory all day anymore:

The startling reason Boral is stopping production almost every day

Chanticleer, The Australian Financial Review

Mr Bansal [the chief executive of Boral] told the Summit that Boral’s electricity price rose by 54 per cent in the 12 months to the second half of last year, and have not retreated, counter to expectations.

He said Boral had about 5500 “blue collar” workers who were being told to stand aside and do nothing for 30 minutes at a time when power prices made it too expensive to operate.

“At a certain price during the day, when the price goes up [to] a certain level, our manufacturing stops because we’ve worked out economically it’s actually better to have thousands of people waiting idle for the prices to come down then actually do the work,” he said.

“That’s a real issue we are facing every single day on 300 manufacturing sites across the country. So we are extremely nervous what that means.”

The chief at Boral pointed out that he’s not willing to sign up to 20 year electricity contracts because everything is so uncertain.

They still don’t understand the difference between reliable and unreliable power

It’s OK, the believers protest, Australia has added 20 gigawatts of solar.

“Australia has three-and-a-half-million solar systems installed and that represents around 20 gigawatts of potential output,” Westerman says.

“That’s more than seven Eraring power stations at full output and capable of meeting almost half the energy demand in the day when the sun is shining at its brightest.”

As if solar panels can be measured on the same page as a coal plant. For half an hour a day, on a good day, only in summer, and as long as the clouds don’t roll over, the peak output might be like seven coal plants. These people are crazy.

The Climate Is Always Changing

Jo Nova writes:

#d6b15c">2,500 years of wild climate change in southern Europe: It was warmer in Roman Times than now

Pyrenes, Cave, Medieval, Little Ice Age, Roman Times. Temperature.By Jo Nova

Nothing at all about the modern era stands out as unusual at all

Thanks to David Whitehouse at NetZeroWatch who has found a remarkable paper: Pyrenean caves reveal a warmer past

The new study on stalagmites in caves of the Pyrenees shows that modern climate change is nothing compared to normal fluctuations in the last 2,500 years, when it was at times  much hotter, colder, and more volatile. Rapid shifts between temperatures were common.

The researchers looked at 8 stalagmites in 4 caves and local lake levels, but they also compared their results with other European temperature proxies and reconstructions and the pattern is consistent across the region. The Roman Warm Period was much hotter than today, and for hundreds of years as well, even though coal plants were rare. Apparently, there was a reason Romans were dressed in togas.

The Dark Ages were very cold, especially around 520 – 550AD — which may be related to what the researchers call a “cataclysmic” volcanic eruption that took place in Iceland in 536AD. It was followed by two other massive volcanoes in 540 and  547AD. This effect is apparently visible in European tree rings which showed “an unprecedented, long-lasting and spatially synchronized cooling”.

Indeed, the researchers declare that volcanoes and solar variability appear to be the main drivers of the climate in SouthWestern Europe.

So finally we see one long continuous proxy record from ancient Greek times right through until 2010. The big question is why these sorts of studies are not done everywhere and all the time. It’s not like we don’t have plenty of caves with stalagmites to analyze. If the climate really was “the biggest threat to life on Earth” why are these extraordinary datasets not the top item on the wish-list of every institution that claims they cares about the climate?

There will be more to say on this remarkable paper:

Pyrenes, Cave, Medieval, Little Ice Age, Roman Times. Temperature.

Click to enlarge. Oxygen isotopes are used to estimate temperatures.


Some passages from the paper discuss how these results match other studies from Europe

The cold event at ca. 540 AD (the coldest of the speleothem record) may be related to a cataclysmic volcanic eruption that took place in Iceland in 536 AD and spewed ash across the Northern Hemisphere, together with the effect of two other massive eruptions in 540 and 547 AD (Sigl et al., 2015). An unprecedented, long-lasting and spatially synchronized cooling was observed in European tree-ring records associated with these large volcanic eruptions, corresponding to the LALIA period (Büntgen et al., 2016).

Some passages from the paper discuss how these results compare with many other studies from Europe and with stark moments in history.

5.2.2. Temperature variability in W Europe and the W Mediterranean during last 2500 years
There are very few high-resolution speleothem records in Europe covering the CE (Comas-Bru et al., 2020). We compare the Central Pyrenean speleothem composite with nine selected speleothems records in Europe  and northern Africa which cover with robust chronology and decadal resolution the last 2500 years (Fig.  5). One of these records is interpreted as NAO variability (Baker et al., 2015), three are paleo-precipitation reconstructions (Ait Brahim et al., 2019; Cisneros et al., 2021; Thatcher et al., 2022) and the other five are  reflecting paleo-temperature variations (Affolter et al., 2019; Fohlmeister et al., 2012; Mangini et al., 2005;  Martín-Chivelet et al., 2011; Sundqvist et al., 2010). Considering these differences in the interpretation and the fact these records are from different regions with different climates (from Sweden to Morocco), dissimilar profiles of paleoclimate variability can be expected. Still, some features are comparable and can be discussed to obtain a super-regional picture.

A. The Roman period in Europe-W Mediterranean. In Europe, and particularly in the Mediterranean region, the RP is well-known as a warm period (e.g., McCormick et al., 2012). The average sea-surface temperature in the western Mediterranean Sea was 2°C higher than the average temperature of the late centuries (Margaritelli et al., 2020). Our composite, with high values of normalized  18O values during the whole RP, and particularly from 0-200 AD, agrees with the scenario of warm temperatures (Fig. 5i). Speleothem data from the Balearic Islands (Cisneros et al., 2021) indicate a transition from humid to dry conditions along the Iberian-RP (Fig. 5c). The dry period at the end of the RP in the Balearic record, appears in agreement with a new speleothem record from northern Italy (Hu et al., 2022), suggesting that the observed drying trend was a possible contribution to the collapse of the Roman Empire in 476 AD. Record from Morocco (Ait Brahim et al., 2019), contrarily, marks a humid trend at the end of the RP (Fig. 5d). Similarly, an increase in humidity was observed in southern Iberia during the Iberian-Roman Period (Jiménez-Moreno et al., 2013; Martín-Puertas et al., 2009) thus reflecting a large spatial heterogeneity in precipitation during the RP when comparing records from the north and south of the Mediterranean basin.

REFERENCES

Bartolomé, M., Moreno, A., Sancho, C., Cacho, I., Stoll, H., Haghipour, N., Belmonte, Á., Spötl, C., Hellstrom, J., Edwards, R. L., and Cheng, H.: Reconstructing land temperature changes of the past 2,500 years using speleothems from Pyrenean caves (NE Spain), Clim. Past Discuss. [preprint], https://doi.org/10.5194/cp-2023-54, in review, 2023.

No changes in global droughts since 1902 when horses and carts were common

From Jo Nova:

No changes in global droughts since 1902 when horses and carts were common

By Jo Novadesert,tree, sand, drought, dry, doom, death. dystopian.

Any which way you look at global drought measures in the last 120 years this is not the CO2 doom scenario of the IPCC prophesies either in rainfall patterns or in water supplies. The graphs below show rainfall trends shifting slightly due to unknown forces and looking for all the world, like CO2 is irrelevant. Despite the scare campaigns about floods and droughts, and the threats of climate wars over dwindling rivers, there has been no trend in hydrological droughts since the Wright Brothers first flew a plane.

Kenneth Richards at NoTricksZone reported on Shi et al, a paper which looked at trends from 1902 to 2014 in all nine climate zones of the world.

The first graph shows a mixed bag of trends in Meteorological Droughts, none of which are obviously linked to human emissions of CO2. Remember, half of all human emissions since we crawled out of caves has been emitted after 1995. According to CDIAC fully 250,000 Mt of CO2 was emitted up to that year, then we have doubled that in the years since then. If CO2 was a planet transforming molecule, surely we’d see something in the last 25 years?

The bottom line is that if we had climate models with any understanding of rainfall they would be able to predict wet and dry seasons, and trends in droughts, floods, streamflow, and rivers. Instead, like stone-age heathen victims, we wail and lament any time a flood or a drought happens anywhere. We blame camels or cows,  trucks and planes. We change our light globes and hope our houses don’t get washed away on the same floodplains that were inundated 100 years ago.

The first graphs show Meteorological Droughts trends in the nine climate regions (a lack of rain):

The regions codes are on the map below. (Click to enlarge).

Global drought last century. Graphed.

Meteorological Drought trends. (Click to Enlarge) Shi et al 2023

The second set of graphs are the hydrological drought trends (a lack of water supply):

Global drought last century. Graphed.

Hydrological Drought trends. (Click to Enlarge) Shi et al 2023

These are the climate zones the study used:

Global drought last century. Graphed.

Classification of different drought regions of the world. Shi et al 2023

(Essentially Australia is B, Cf and A,  The USA is B, Cf and Df. The UK, France, Germany and NZ are Cf).

#302226;font-family: Candara, Verdana, sans-serif">DEFINITIONS

According to NOAA, a Meteorological Drought is a lack of rain suffered for an extended time, whereas a Hydrological Drought is a lack of water supply such as stream flow, reservoir and lake levels, and ground water.

#302226;font-family: Candara, Verdana, sans-serif">REFERENCE

Haiyun Shi et al (2023) A global perspective on propagation from meteorological drought to hydrological drought during 1902–2014, Atmospheric Research
Volume 280, 15 December 2022, 106441, https://doi.org/10.1016/j.atmosres.2022.106441


NASA: Heat in Northern Hemisphere Caused By Water Vapour Not CO2

From wattsupwththat.com:


What NASA and the European Space Agency are admitting but the media are failing to report about our current heat wave


Reposted from American Thinker

By Thomas Lifson

Bumped from Sunday:

The current heat wave is being relentlessly blamed on increasing levels of carbon dioxide in the atmosphere, but there is a much more plausible explanation, one that is virtually endorsed by two of the world’s leading scientific organizations. It turns out that levels of water vapor in the atmosphere have dramatically increased over the last year-and-a-half, and water vapor is well recognized as a greenhouse gas, whose heightened presence leads to higher temperatures, a mechanism that dwarfs any effect CO2 may have.

So, why has atmospheric water vapor increased so dramatically? Because of a historic, gigantic volcanic eruption last year that I – probably along with you — had never heard of. The mass media ignored it because it took place 490 feet underwater in the South Pacific. Don’t take it from me, take it from NASA (and please do follow the link to see time lapse satellite imagery of the underwater eruption and subsequent plume of gasses and water injected into the atmosphere):

still from the time lapse photos


When the Hunga Tonga-Hunga Ha’apai volcano erupted on Jan. 15, it sent a tsunami racing around the world and set off a sonic boom that circled the globe twice. The underwater eruption in the South Pacific Ocean also blasted an enormous plume of water vapor into Earth’s stratosphere – enough to fill more than 58,000 Olympic-size swimming pools. The sheer amount of water vapor could be enough to temporarily affect Earth’s global average temperature.

“We’ve never seen anything like it,” said Luis Millán, an atmospheric scientist at NASA’s Jet Propulsion Laboratory in Southern California. He led a new study examining the amount of water vapor that the Tonga volcano injected into the stratosphere, the layer of the atmosphere between about 8 and 33 miles (12 and 53 kilometers) above Earth’s surface.

In the study, published in Geophysical Research Letters, Millán and his colleagues estimate that the Tonga eruption sent around 146 teragrams (1 teragram equals a trillion grams) of water vapor into Earth’s stratosphere – equal to 10% of the water already present in that atmospheric layer. That’s nearly four times the amount of water vapor that scientists estimate the 1991 Mount Pinatubo eruption in the Philippines lofted into the stratosphere. [emphases added]

NASA published the above in August 2022. Half a year later, a newer study increased the estimate of the water vapor addition to the atmosphere by 30%. From the European Space Agency:

In a recent paper published in Nature, a team of scientists showed the unprecedented increase in the global stratospheric water mass by 13% (relative to climatological levels) and a five-fold increase of stratospheric aerosol load – the highest in the last three decades.

Using a combination of satellite data, including data from ESA’s Aeolus satellite, and ground-based observations, the team found that due to the extreme altitude, the volcanic plume circumnavigated the Earth in just one week and dispersed nearly pole-to-pole in three months. [emphasis added]

Another scientific paper explains the “net warming of the climate system” on a delayed basis.  NASA’s Jet Propulsion Laboratory further explains:

Volcanic eruptions rarely inject much water into the stratosphere. In the 18 years that NASA has been taking measurements, only two other eruptions – the 2008 Kasatochi event in Alaska and the 2015 Calbuco eruption in Chile – sent appreciable amounts of water vapor to such high altitudes. But those were mere blips compared to the Tonga event, and the water vapor from both previous eruptions dissipated quickly. The excess water vapor injected by the Tonga volcano, on the other hand, could remain in the stratosphere for several years.

This extra water vapor could influence atmospheric chemistry, boosting certain chemical reactions that could temporarily worsen depletion of the ozone layer. It could also influence surface temperatures. Massive volcanic eruptions like Krakatoa and Mount Pinatubo typically cool Earth’s surface by ejecting gases, dust, and ash that reflect sunlight back into space. In contrast, the Tonga volcano didn’t inject large amounts of aerosols into the stratosphere, and the huge amounts of water vapor from the eruption may have a small, temporary warming effect, since water vapor traps heat. The effect would dissipate when the extra water vapor cycles out of the stratosphere [Emphases added]

So there you have it: we are in for extra atmospheric heat “for several years” until the extra water vapor injected by this largest-ever-recorded underwater volcano eruption dissipates.

Jeff Childers, who brought this scientific data to my notice, writes:

 Here’s why corporate media is ignoring the most dramatic climate even[t] in modern history: because you can’t legislate underwater volcanoes. You can try, but they won’t listen. So what’s the fun in that? Corporate media only exists to further political ends. Since volcanoes aren’t subject to politics, why bother?

 He brings up the work of Ethical Skeptic:

Ethical is suggesting that the water is heating the air — instead of the other way around. And the Earth’s core is heating the water.  It’s a theory that explains everything.

Meanwhile, “science” is baffled. From just a month ago, in mid-June:

See? But though scientists are baffled, corporate media and its repulsive allies are busily blaming ocean warming on carbon dioxide — a ludicrous notion.

I am the first to admit that none of this – not the atmospheric CO2 theory of global warming, nor the effect of the largest ever known undersea volcanic eruption – is scientifically proven. But before we impoverish ourselves trying to reduce CO2 emissions (while watching China dramatically increase them), let’s practice real science and not jump to conclusions based on an imaginary “consensus.”

Jo Nova: It’s Not That Hot

Climate panickers think that if it’s summer, it must be the hottest ever. The Medieval Warm Period was warmer than where we are now, and no nasty coal and oil to blame then.

Jo Nova writes:

European heatwaves: Soldiers died in the heat in 1160, Rivers ran dry in 1303, animals fell dead in 1393

By Jo Nova

Medieval “climate change” was filled with heatwaves, droughts, and crop failures

One thousand years ago, “rivers ran dry under the protracted heat, the fish were left dry in heaps and putrefied in a few hours.”  Men and animals venturing in the sun in the summer of 1022 fell down dying.”

It was so hot in 1132 that the rivers ran dry and “the ground was baked to the hardness of stone”.  Around 1200 at the Battle of Bela “there were more victims made by the sun than by weapons”. In 1303 and 1304, the Seine, the Loire, the Rhine, and the Danube could all be crossed with dry feet, and they dried up again in 1538-1541. In 1393 and 1394 the crops were “scorched up” and “great numbers of animals fell dead”. In 1625 in Scotland, it was so hot “meat could be cooked merely by exposing it to the Sun.”

And so it goes — history that was known in the 1800’s appears to be disappearing, leaving us with a generation of snowflakes who think they are the only humans who ever faced hot weather. They with their airconditioned bedrooms, mobile phones and filtered water.

In 879, agricultural laborers, who must have been as tough as nails, were struck down after “just a few minutes in the sun”.

Thanks to Tony Heller at RealClimateScience who has a resource page: “1500 Years of Heatwaves”

Gaillard’s Medical Journal – Google Books

Heatwaves of Europe in Medieval times.

The Medieval Warm Period was a global phenomenon, see the graphs, the pollen, the sea sediments and tree rings. And the IPCC knew it in 1990 too.

IPCC FAR Report, Medieval Warm Period.

1990 IPCC FAR Report, Medieval Warm Period.

They’ve been rubbing out the Medieval Warm Period ever since. Even though Hubert Lamb did the graph in 1982, scores of different proxies have gone on to support it on every continent.  References at the link above plus at the tag Medieval Warm Period.

h/t also Paul Homewood at Notalotofpeopleknowthat

Text copied below:

“Hot Weather.—Many a man has mopped his brow during the summer months of 1884, declaring it was the hottest weather the world ever knew, which, of course, would not be true, for the extreme heat in the record of the past has not been approached during the late summer.

In 627, the heat was so great in France and Germany, says the London Standard, that all springs dried up; water became so scarce that many people died of thirst.

In 879, work in the field had to be given up; agricultural laborers persisting in their work were struck down in a few minutes, so powerful was the sun. In 993, the sun’s rays were so fierce that vegetation burned up as under the action of fire. In 1000, rivers ran dry under the protracted heat, the fish were left dry in heaps and putrefied in a few hours. Men and animals venturing in the sun in the summer of 1022 fell down dying.

In 1132, not only did the rivers dry up, but the ground cracked and became baked to the hardness of stone. The Rhine in Alsace nearly dried up. Italy was visited with terrific heat in 1189; vegetation and plants were burned up. During the battle of Bela, in 1200, there were more victims made by the sun than by weapons ; men fell down sunstruck in regular rows. The sun of 1277 was also severe; there was an absolute dearth of forage.

In 1303 and 1304, the Rhine, Loire and Seine ran dry. In 1615, the heat throughout Europe became excessive. Scotland suffered particularly in 1625 ; men and beasts died in scores. Meat could be cooked by merely exposing it to the sun. Not a soul dared to venture out between noon and 4 p.m. In 1718, many shops had to be closed; the theatres were never opened for several months. Not a drop of water fell during six months.

In 1753 the thermometer rose to one hundred and eighteen degrees. In 1779, the heat at Bologna was so great that a large number of people died. In July, 1793, the heat became intolerable. Vegetables were burned up and fruit dried upon the trees. The furniture and woodwork in dwelling-houses cracked and split up; meat became bad in an hour.

In Paris in 1846, the thermometer marked one hundred and twenty-five degrees in the sun. The summers of 1859, 1860, 1869, 1870, 1874, etc., although excessively hot, were not attended by any disaster.”

Europe Shuts Down Due To “Green Energy”

Australia is not far behind as we lurch towards the madness of “Net Zero”

From Jo Nova

#d6b15c">UK close to nation wide blackout, while 12% of entire Germany GDP paying for energy crisis

By Jo Nova

Green Europe is running out of electrons

Last Monday in Great Britain the entire steel industry shut down because the wind stopped and wholesale prices reached £2,586 a megawatt-hour.  As winter cranks up, British factories are getting ready to shutdown, as the threat of small, medium and blockbuster blackouts loom. In the fifth largest economy in the world, thousands of people are using communal warm spaces because they can’t afford electricity any longer, and the largest North Sea gas producer has decided not to drill for more gas just when the country needs it. The government has slapped a new tax on it, thus achieving the exact opposite of what the government aimed for.

Meanwhile over in Germany one eighth of the entire national economy is now consumed with paying for the energy crisis of 2022. They tried to hold back the seas in 2100 but forgot to secure their own electricity a year in advance.

These are very expensive experiments

They aren’t telling you this but UK is close to nationwide blackouts

by David Maddox , Daily Express

UK Flag, Britain, United Kingdom.

But the one nobody is discussing is the real possibility the lights could go out. Two stories this week should set the alarm bells ringing. The first was that Drax had been ordered to put its (mothballed) two coal-fired power stations in North Yorkshire on standby. The second came yesterday when a power cut left 2,800 homes in Shetland without electricity. In one of the coldest snaps in recent history where energy use has been peaking, they underpinned a briefing received by Express.co.uk that Britain is teetering on the edge of a catastrophe.

According to someone close to Mr Rees-Mogg [former Business and Energy Secretary], his conclusion was: “If the lights don’t go out this winter or next it will be more luck than judgement.”

His assessment, confirmed by a Whitehall source, was the margins of available energy supply to need were so low that “just one major problem would be enough for the lights to go out.”

The reality is that Whitehall sources and former ministers have confirmed to the Daily Express the well-intentioned headlong pursuit for Net Zero carbon emissions has left the UK in a precarious position.

After becoming the minister Rees-Mogg apparently had to badger staff for two whole weeks just to get an inventory of Britain’s energy supplies. Were they slow because they didn’t want to give him the bad news, or because they had never added them up?

Britain braces for winter of factory shutdowns as freezing conditions strain energy crisis
Jacob Paul, Daily Express

Gareth Stace, director of industry association UK Steel, told the Telegraph that the eye-watering wholesale electricity prices on Monday forced all his members to shut down some production until rates went back to normal.

He said: “We’re just priced out of the market. There would be no point in the energy companies telling our members to turn off, because they know that they will. You just couldn’t keep going, you just lose money for every tonne of steel you make with [energy] prices at these levels.”

Think of what €440 billion euro’s could have done instead?

German FlagThat’s how much Germany has spent on energy bailouts and schemes since Russia invaded Ukraine. And it probably doesn’t include another 100 billion euro money bomb that was just approved in the German lower house.

Germany’s half-a-trillion dollar energy bazooka may not be enough

Reuters

Michael Groemling at the German Economic Institute (IW) said… “The national economy as a whole is facing a huge loss of wealth.”

The money set aside stands at up to 440 billion euros ($465 billion), according to the calculations, which provide the first combined tally of all of Germany’s drives aimed at avoiding running out of power and securing new sources of energy.

That equates to about 1.5 billion euros a day since Russia invaded Ukraine on Feb. 24. Or around 12% of national economic output. Or about 5,400 euros for each person in Germany.

They could have bought 20 nuclear reactors and secured half their electricity supply for decades to come.

Trump warned about this in 2018, but this trainwreck has been coming for twenty years.

Thanks to NetZeroWatch