Jo Nova: There were Bigger Floods and Rain-bombs in the 1800’s

Jo Nova writes:

If only the $3 million dollar a day ABC could afford a science team that could do as much research as one unpaid volunteer does in a day?

Thanks to Cliff Ollier and Ken Stewart for the BOM graph of past Brisbane Floods. Clearly things were worse in the 1800s.

If CO2 has any effect perhaps it reduces flooding?

There have always been big floods in Brisbane       | BOM Source   |  KensKingdom

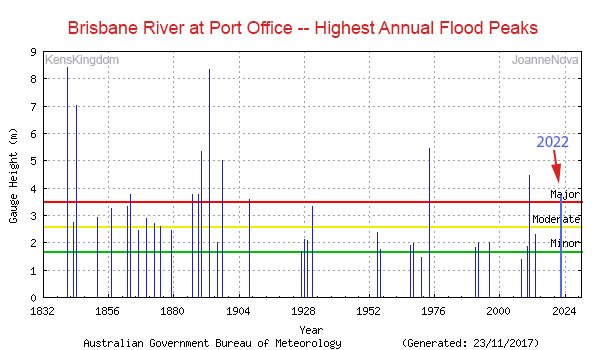
One day when the ABC finally gets the Internet they’ll be able to find official pages like “Known Floods in the Brisbane and Bremer River Basin“. And one day the half billion dollar BOM agency will be able to update graphs like this within a week of a new flood peak, like bloggers did (above).

Ken Stewart went looking for lost Rain Bombs and found them

As Ken reports the ABC made a fuss over three Queensland sites recording more than 1 metre of rain in just four days. But neither the ABC or the BOM is telling Australians that there have been at least nine similar “Rain Bombs” before and most of them were more than one hundred years ago.

I went looking at Climate Data Online for four day rainfall totals over one metre, to compare with the recent totals above at Mount Glorious, Pomona, and Bracken Ridge. For a start, Pomona’s BOM station has been closed for years, and Bracken Ridge is not listed at all, so those reports are from rain gauges external to the BOM network and can’t be checked.  That’s OK.  In about half an hour I found the following four day rainfall records.

Crohamhurst4/2/18931963.6mm
Yandina3/2/18931597.8mm
Tully Sugar Mill13/02/19271421.3mm
Palmwoods4/2/18931244.6mm
Buderim3/2/18931150.3mm
Bloomsbury20/01/19701141.8mm
Dalrymple Heights6/04/19891141mm
Innisfail3/04/19111075.8mm
Nambour11/1/18981013mm

1893 was a wet year!  Crohamhurst had 2023.8 in five days, and Brisbane had three floods in two weeks in February and another in June.

And there is no such thing as a “rain bomb”, a term invented to make it sound unprecedented.  This was an entirely natural and normal rain event.  Slow moving tropical lows drift south every few years in the wet season, producing a large proportion of Queensland’s average rainfall.

It’s another Red pill moment. Spread the news. Australians need to know the media and the BOM are not giving them the whole truth. Has anyone in the BOM called up the ABC and corrected their mistake? Isn’t that their job?

Hundreds of Scientific Papers Say There Is No “Climate Change”

From wattsupwiththat.com comes this interesting revelation that last year there were 148 scientific papers that state there is no global warming.

What Global Warming? 148 New (2020) Scientific Papers Affirm Recent Non-Warming, A Degrees-Warmer Past

By Kenneth Richard on 14. January 2021

Scientists continued defying the “unprecedented” global warming narrative by publishing nearly 150 papers  in 2020 that show large regions of the Earth (a) haven’t warmed in recent decades, (b) were as-warm or warmer within the last several centuries, and/or (c) were 1-7°C warmer than today just a few millennia ago.

Here is the link to the 2020 (and 2019) Non-Global Warming scientific paper database:

Non-Global Warming Studies From 2020 & 2019

Below are 8 examples of the 148 non-global warming papers published in 2020.

Read the full article here, together with extracts from some of the papers.

Jo Nova: Hottest ever day in Australia — especially if you ignore history

From Joanne Nova:

Tuesday was Australia’s hottest day on record sayth the Bureau of Meteorology.

And perhaps it was. But look at the temperatures reported in newspapers across the country during the month of January in 1896 when people were going mad with axes, dropping dead in coaches and railway stations and birds were falling lifeless from the trees? Emergency trains were ferrying people from the country to the mountains. Panic stricken people fled the outback on special trains and the death toll was  hundreds die.

Fifty years later scientists would publish papers talking about how Australian summers had cooled since then.

How does the BOM know for sure that it was not hotter on any one of these days?  Perhaps they don’t. Wouldn’t it be more honest of the BOM to mention that? It’s not like billions of dollars depends upon it…

Seems the only time the ABC or BOM suddenly discover our historic weather records is when we get unseasonal snow or freezing cold.

The heatwave started in the West on Jan 1st and travelled eastwards, as most heatwaves do. The hottest day was possibly Jan 23 or 24 in 1896 which is when most of the Eastern States maximum temperatures shown above were recorded. And there are hints that this was both widespread and long — some of these towns recorded three long weeks of ultra high temperatures close to and over 110F (43.3C) like Nannine in WA (near Meekatharra) and Cunnamulla in Qld. Both reported peaks as high as 120F (48.8C). In Bourke temperatures were above 102F (38.9C) for 24 days in a row.

The BOM will say things were not entirely standardized or approved back then. But why would they care? Many of the BOM’s current sites fail their own standards:  thermometers may sit for 30 years over bitumen, or right next to incinerators. They plough around sites, move them, build walls next to them and forget, even next to their own offices. The BOM accept one-second records from new electronic gizmo’s in small screens, and adjust old temperatures down by as much as two whole degrees. Sometimes modern BOM sites need mysterious calendar monthly corrections, or get corrected by thermometers across the Bass Strait, and sometimes they are incredibly detailed but repeat robotically year after year. Remember those temperature maps of our deserts in WWI? There are sites where there are no thermometers which record exactly the same temperatures as they did the year before (and the year after). Just “made up”? The hottest day ever recorded was probably calculated with maps like that.

Read the full story here

Coldest Summer Day Ever

From Michael Smith and weatherzone.com. I noticed the ABC were all over this one (NOT).

Australia’s record lowest Summer daily-max temperature has just been broken, as reported by www.weatherzone.com.au.

A brutal Antarctica air-mass blasted southeastern Australia during the opening days of summer, pumping deep snow into parts of Tasmania, Victoria and NSW, as well as limiting temperatures to as much as 15C below the seasonal average.

On Tuesday, December 03, Thredbo Top Station‘s highest recording was a mere -1.0C (30.2F) — this was Australia’s lowest summer daily maximum temperature of all time, busting the -0.8C (30.6F) measured at Mount Buller on Dec 25, 2006 (approaching the historically deep solar minimum of cycle 23).

Furthermore, an overnight low of -4.0C (24.8F) was observed at Tasmania’s Mount Wellington early Wednesday morning, Australia’s lowest summer temperature in four years.

Read more at https://www.michaelsmithnews.com/2019/12/australia-just-suffered-its-coldest-summer-day-on-record-.html

“Climate Emergency”- Dodgy Records Ignore the Facts

Climate “science” is a joke these days, long being hijacked by extremist activists and lavish Government funding.

You may have heard of the European heatwave recently smashing temperature records in Germany and other places.

As usual the truth is less scary. Last year is was an ice cream truck parked right next to a weather station in England. This year it is a poorly located weather station, admitted by the DWD, the German Weather Bureau, to be badly sited, but still used by the DWD to hype up the climate scare!

A nearby resident did some research and found that the temperatures there were typically nearly 3 degrees warmer than other stations.

But a record is a record, even if it’s faked.

From wattsupwiththat.com

It’s Colder Than We Thought

Amidst all the hype about global warming that continues amidst 20 years of no change in temperature, scientists have found that some places are colder than we could imagine.

In Antarctica scientists have measured the lowest temperature yet recorded on the planet. -98C which is down 5 degrees from the previously measured record of -93. To get that low, clear skies and low humidity must persist several days. 

It is believed that it is theoretically possible for temperatures to go to -100C.

So the next time the ABC tells us Antarctica is melting, remember that this is not the full story, and that it is still a very very cold place.

Read the full article here

Jo Nova On Warming In The Antarctic

You may have head on the ABC about how the Antarctic is losing its ice cover and one day will be ice free. Scientist Jo Nova puts that into context

Antarctic Ice Loss Tripled, from near zero to an extremely tiny number! (Nobody mention those volcanoes)

Quick — tax the magma

It’s another round of Antarctic Doom about next to nothing. In April Antarctica’s ice was melting five times faster than usual. Now it’s losing ice three times faster in the last five years than the 15 before that! What you won’t hear is how the Antarctic ice cap has 29 million cubic kilometers of ice and has been there for 30 million, mostly warmer, years. You also won’t hear how Antarctica was warmer in Roman Times, or that the  Antarctic Peninsula has cooled by almost 1 degree.

You also won’t hear a word about any volcanoes

The new paper has zero mentions of the word. But other scientists have published plenty of papers describing how the West Antarctic zone is being warmed from below by 1200 degrees of magma. According to scientist Dustin Schroeder and co,  it is as if the Thwaites Glacier in West Antarctic is sitting on a “stovetop burner”.[1]  His words. Thwaites Glacier,, smack in the middle of the warming is being melted from below by geothermal heat. Then there is the large blob of superheated rock 60 miles below West Antarctica. The researchers use the phrase “like a blow-torch”….  Capping it off, only last year 91 new volcanoes were discovered 2km underneath the West Antarctic Rift. That’s new, as in, we didn’t know they were there.

Follow the reasoning, either a trace gas 10 kilometers up is causing some spots of Antarctica to warm and other parts to cool, or hot magma at 1,200C is. What’s more likely?

Antarctic ice, warming, melting, map, graphic, location of volcanoes, geothermal heat.

Antarctic ice is warming in West Antarctica and the Peninsula, but not over most of East Antarctica.


From the new paper we get the same old pattern. The biggest part of Antarctica is East Antarctica and it’s not melting — even in this alarming new paper.

I thought there was CO2 there as well?

Antarctic Melting, 2018. Graph

The battle of Big Meaningless Numbers

From the abstract we find tiny fractions are written up as big numbers of small units with no real context. Then they extrapolate a 6 year trend on an ice mass that’s been around for millions of years.  Adding up the losses, in this “worst of the worst” scenarios Antarctica might be losing 187 billion tonnes of ice per year (give or take a lot). That’s 187 cubic kilometers of ice, which sounds like a lot until we look at the size of the Antarctic Ice Sheet (29 million kilometers cubed). At this new “accelerated” rate the total loss is one 155,00oth of the total mass. Expressed another way, it’s 0.0006%. At this rate Antarctica will be entirely melted 155,000 years from now.

This agrees quite well with the April round of Antarctic Doom which implied it would melt in 118,000 years. Lucky us, we have 30,000 years to spare now.

The first line in the paper’s introduction:

“The ice sheets of Antarctica hold enough water to raise global sea level by 58m.”

Handy to know what people in 155,000 A.D. will be facing. Now that’s forward planning….

A Day Of Extremes

While Australia was sizzling through a heatwave yesterday, which may or may not have set some records- some of which are up to 20 years old- it was actually snowing in the Sahara Desert.

For more on the snowy Sahara (the second year in a row it snowed there) click here. Jo Nova has the details about why the Sydney heat “record” is less than impressive.

In Narrabri we have the regular “Narrabri Airport sets new record” fairly often because they moved the official weather station from Narrabri West P.O. about 20 years ago,

I think the Bureau of Meteorology needs to stop being a publicity channel for “climate change” and go back to its roots in science- the old variety of trying to be objective as opposed to post-modern, post-truth “science”.

Another “Green”Hare-brain Scheme

The ABC is breathlessly reporting that London busses may soon be powered by waste coffee grounds. This is a relief to those who also bought the story about global warming, if unchecked, could reduce the area suitable for coffee cultivation.

So here’s the plan. You go to all those coffee shops around London, scrounge their bin for a litre or two of waste, take it to the factory, refine it and there you have it- “bio-diesel” for your bus fleet.

Here is the problem. You have a choice of a product that is low and variable quality and distributed in small quantities over a large area which then  has to be refined in a small scale facility and then sent to the bus fuel station. Or you could use a product of known and standardised quality, produced in huge quantities through known processes and with already established distribution facilities.

It’s not hard to work out which is going to win hands down.

I started to try to work out a rough estimate of costs but there isn’t enough information to go on. I suspect that residents of London will end up paying more in the name of saving the planet, with no real guarantee that they are reducing CO2 emissions which is given as the aim of the process.

Amazing: Plants Adapting to Increased CO2

The CSIRO has found that plants around the world are absorbing more CO2 and doing it more efficiently than ever before. As the concentration of CO2 rises in the atmosphere all kinds of plants are growing faster, but using relatively less water to do so.

This confirms the satellite images showing that the world is greening.

Rising carbon dioxide is making the world’s plants more water-wise

Land plants are absorbing 17% more carbon dioxide from the atmosphere now than 30 years ago, our research published today shows. Equally extraordinarily, our study also shows that the vegetation is hardly using any extra water to do it, suggesting that global change is causing the world’s plants to grow in a more water-efficient way.

Water is the most precious resource needed for plants to grow, and our research suggests that vegetation is becoming much better at using it in a world in which CO₂ levels continue to rise.

The ratio of carbon uptake to water loss by ecosystems is what we call “water use efficiency”, and it is one of the most important variables when studying these ecosystems.

Our confirmation of a global trend of increasing water use efficiency is a rare piece of good news when it comes to the consequences of global environmental change. It will strengthen plants’ vital role as global carbon sinks, improve food production, and might boost water availability for the well-being of society and the natural world.

Read the full article here